Pro Tips For Maximizing MSTR Returns Using Bitcoin Market Data
Bitcoin Magazine

Pro Tips For Maximizing MSTR Returns Using Bitcoin Market Data
Since Michael Saylor and his team at Strategy (formally MicroStrategy) first invested in Bitcoin, the company has significantly outperformed Bitcoin itself. With the right data points and strategies, investors can further enhance their returns. In this article, we’ll explore how to leverage various metrics to improve your MSTR investing.
Key Takeaways
- MSTR has outperformed Bitcoin by over 3,000% since its initial investment.
- Key indicators like MVRV Z-Score and Active Address Sentiment can help time investments.
- Global liquidity trends also impact MSTR’s performance.
- Using multiple data points can simplify and enhance investment strategies.

MSTR’s Outperformance Over Bitcoin
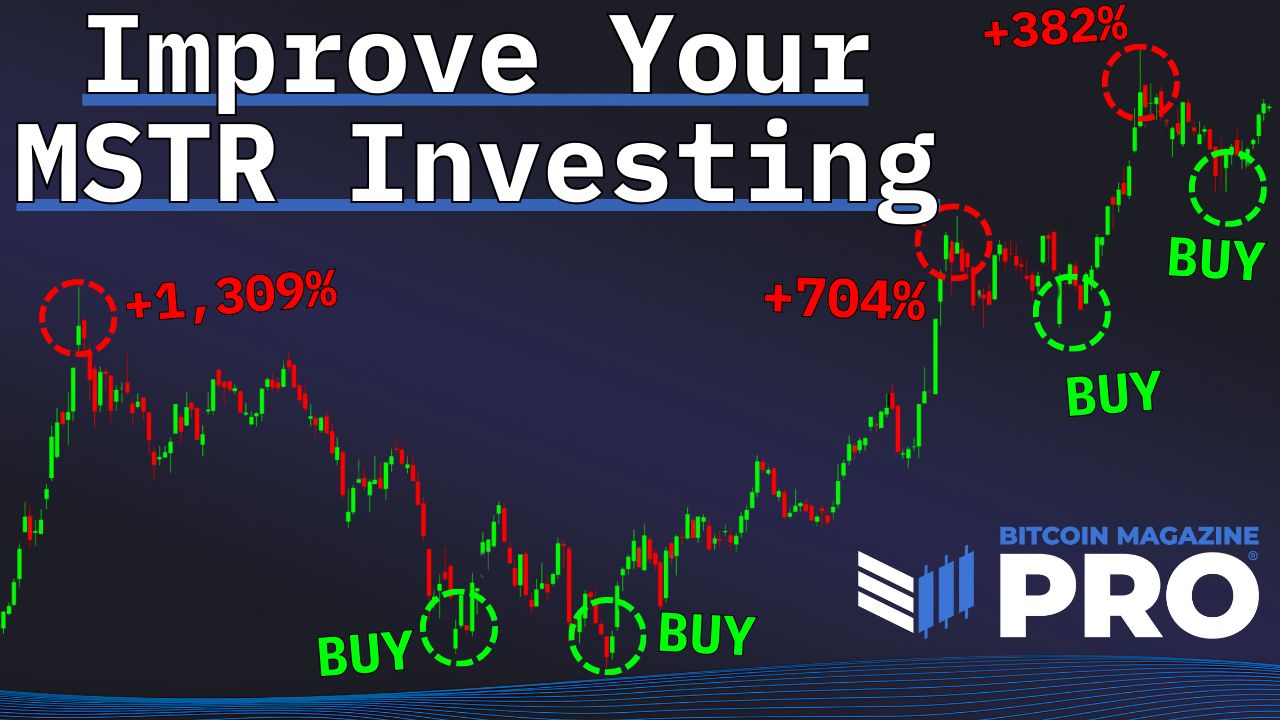
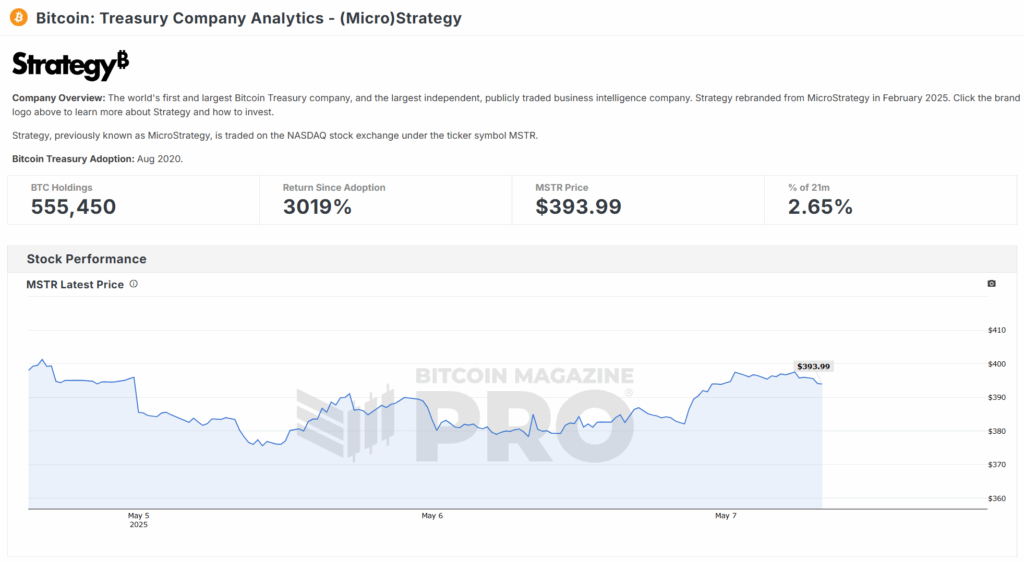
MicroStrategy, now rebranded as Strategy, has made headlines with its Bitcoin investments. Since the company began accumulating Bitcoin, it has achieved returns exceeding 3,000%, while Bitcoin itself has seen around 700% growth. This stark contrast highlights the potential of investing in companies that hold significant Bitcoin assets.
Understanding Key Metrics for MSTR Investing
To improve your MSTR investment strategy, it’s essential to utilize various data points. Here are some key metrics to consider:
- MVRV Z-Score: This metric helps gauge whether Bitcoin is undervalued or overvalued. By analyzing the market cap against the realized cap, investors can identify optimal buying and selling points.
- Active Address Sentiment Indicator: This tracks network utilization and user changes, providing insights into market sentiment. When the price change crosses certain thresholds, it can signal when to take profits or accumulate more.
- Crosby Ratio: This technical indicator helps identify potential market peaks and troughs, allowing for better timing of trades.
- Global Liquidity: Monitoring global liquidity trends can provide insights into broader market movements that affect MSTR’s stock price.
Using MVRV Z-Score for MSTR Investing
The MVRV Z-Score is a powerful tool for assessing Bitcoin’s market conditions. When the score dips into the green zone, it indicates a good time to buy. Conversely, when it reaches the red zone, it may be wise to consider selling. This metric can also be applied to MSTR, given its strong correlation with Bitcoin.

Active Address Sentiment Indicator Explained
The Active Address Sentiment Indicator tracks the percentage change in network users alongside Bitcoin’s price action. When the price change crosses above a certain level, it may indicate an overheated market. This can be a signal to lock in profits. Conversely, when it dips, it might be a good time to buy more.

The Impact of Global Liquidity on MSTR
Global liquidity has a significant correlation with MSTR’s performance. By tracking liquidity trends, investors can anticipate potential price movements. For instance, a 365-day correlation shows a strong link between global liquidity and MSTR, which can be enhanced by adjusting the time frame for analysis.

Value Days Destroyed Indicator
This indicator measures the impact of Bitcoin price action on MSTR. By analyzing how value days destroyed correlate with MSTR’s price, investors can identify optimal buying and selling opportunities. This metric has shown to be particularly effective for MSTR, potentially due to its leverage on Bitcoin’s volatility.

Conclusion: Data-Driven MSTR Strategies
In summary, MSTR’s strong correlation with Bitcoin means that many of the same metrics used for Bitcoin investing can also apply to MSTR. By utilizing tools like the MVRV Z-Score, Active Address Sentiment Indicator, and monitoring global liquidity, investors can enhance their MSTR investment strategies.
As Michael Saylor continues to accumulate Bitcoin, the potential for MSTR to perform well remains high. By keeping an eye on these indicators, you can simplify your investment decisions and potentially increase your returns.
If you found this information helpful, consider exploring more resources and analytics to stay informed about both Bitcoin and MSTR. The right data can make all the difference in your investment journey!
For more deep-dive research, technical indicators, real-time market alerts, and access to a growing community of analysts, visit BitcoinMagazinePro.com.

Disclaimer: This article is for informational purposes only and should not be considered financial advice. Always do your own research before making any investment decisions.
This post Pro Tips For Maximizing MSTR Returns Using Bitcoin Market Data first appeared on Bitcoin Magazine and is written by Mark Mason.
Source: Bitcoin Magazine – Read More


Leave a Reply
Want to join the discussion?Feel free to contribute!